The axe DevTools browser extension for Chrome is the single best tool I’ve found to check for accessibility problems on web pages. Here’s why.
What is axe DevTools? That sounds complicated.
The axe DevTools browser extension is powerful but not complicated. It’s a tool you can add to your desktop browser for free. Whenever you want, you can tell it to scan the page you’re browsing for accessibility issues. It then shows you a list of issues to address. I think it’s helpful to be walked through it once to get oriented, but from there it’s smooth sailing.
Who is axe DevTools for? It sounds like a developer thing.
Anyone can install and run the axe DevTools browser extension. Web designers can and should install it. Quality engineers can and should install it. Web developers can and should install it.
What types of websites can I run this extension on?
You can run the axe DevTools extension on any web page that you are browsing. Does the site require a login? That’s easy – as a user, just log in and the run axe DevTools scan again. Do you have different views and layouts based on a responsive layout? No problem – change your screen size, and run the axe DevTools scan again. The scan runs against whatever is in your browser.
Is axe DevTools this free? What aren’t you telling me?
The extension is free. There’s some other pro-related stuff you can use, but I don’t know enough about it to talk about it. I’ve just always used the free extension part. It also seems to be part of a suite of tools for doing automated testing, and running things against an entire site – I don’t know much about those extras. (That’s when it really seems to get into ‘this-part-is-for-developers’ territory.) I make hobbyist websites and the free axe DevTools browser extension is more than enough for my needs.
Are you paid by axe DevTools?
No. I have no affiliation to Deque (the maker of this extension) – I just use and like the free version of the tool.
How to install axe DevTools
I use Chrome on a MacBook, and I’m writing this from that perspective. I think the same applies to using Edge as well, and I don’t think it matters whether you’re on Windows or Mac. If any of this can be done on Safari, I’d be surprised. Also, I don’t know if it can work on Android or iOS at all.
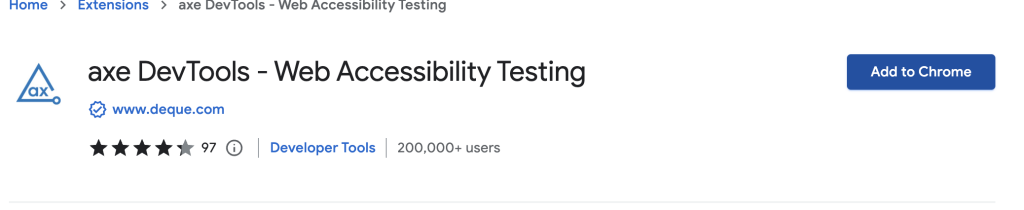
In Chrome, do a Google search for ‘axe Devtools chrome extension’. Alternatively, here is a link to axe Devtools chrome extension.
On the chrome extension page, click the ‘Add to Chrome’ button.
Chrome will then do the equivalent of asking ‘Are you sure you want to install this’ – go ahead and add the extension.
After doing so, Chrome may route you directly to a page built by Deque (the company that makes axe) showing how to use it. You can read that but you don’t have to leave it open.
How to use axe DevTools
Now that you have the extension, pretty much on any part of a web page, you can right-click and choose ‘inspect’.
After left-clicking ‘Inspect’, the Chrome dev tools panel will appear.
DevTools can be positioned in a variety of locations – on the bottom of the browser window, or on the side, or even in its own window. The screenshots here assume it’s on the bottom. To get more familiar with how to position the Chrome DevTools menu, the reader will need to look elsewhere.
In the screenshot below, you can see that ‘axe DevTools’ is one of the menu items now in Chrome’s DevTools. It may be behind an arrow if there are too many options to show at once.
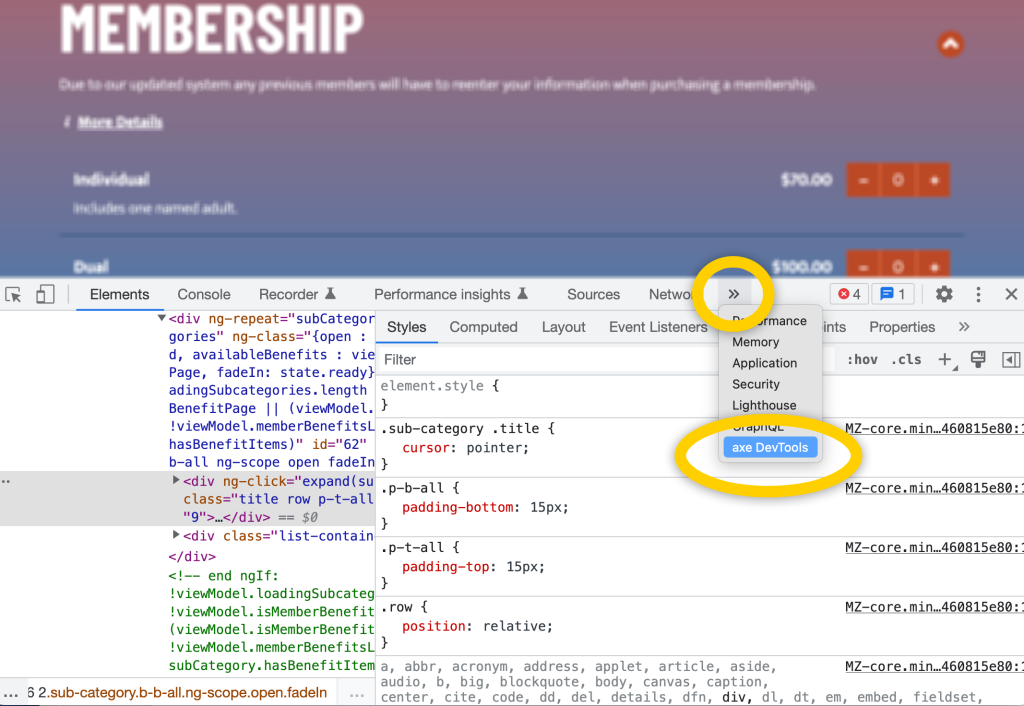
Select ‘axe DevTools’.
I think the first time you install, it may ask you to agree to the terms. It also asks what kind of role you have – I just say ‘Developer’
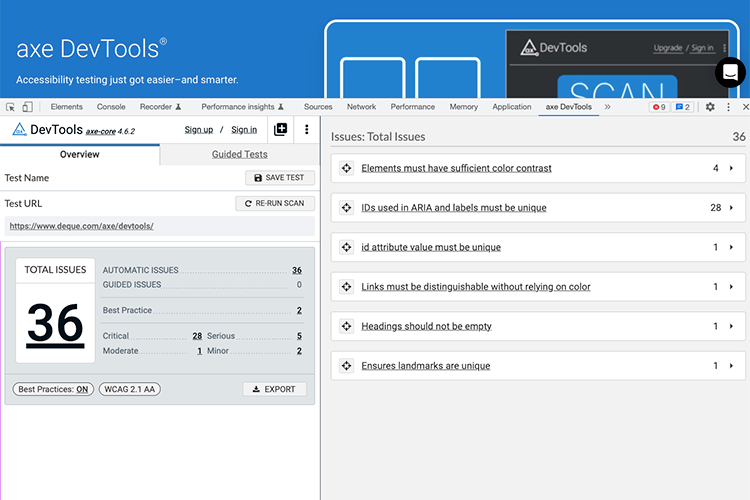
Once done, you’ll see the axe DevTools interface. This can look different depending on the size of the browser. My screenshots henceforth will assume a fairly wide window, as if using most of a 15″ laptop window.
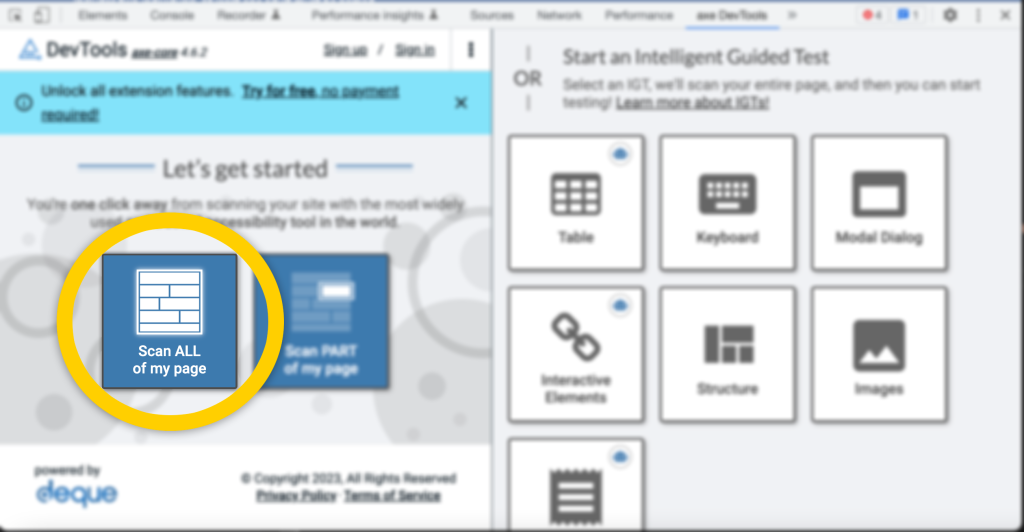
I think the interface is a little overwhelming if you’re not in it day-to-day. The interface has changed over the years, and will likely continue to do so, so if what you see is different from what’s in this screenshot, that wouldn’t surprise me. To get started, I recommend just finding and clicking the option that says ‘Scan ALL of my page.”
I’ve gone to the Memphis Zoo website’s membership page and ran the scan. It came back with the following:
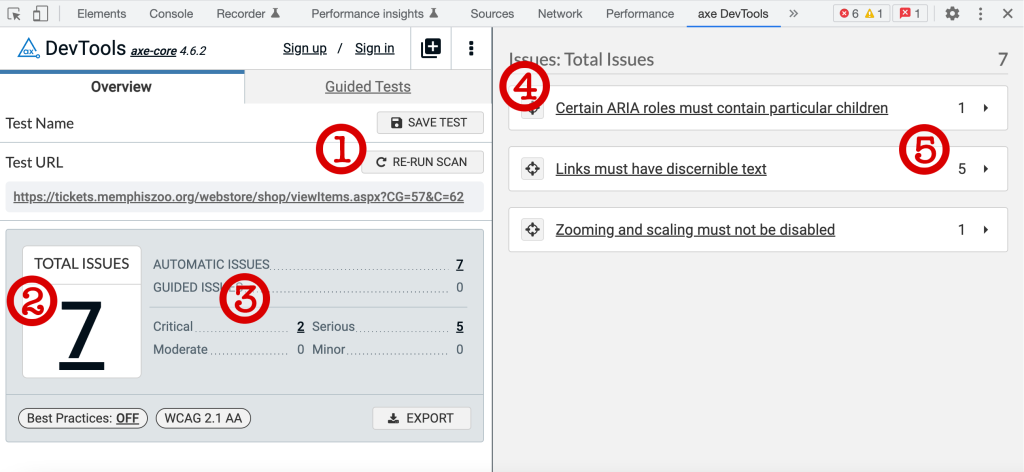
The red numbers in the screenshot above correspond to the following numbers in the list:
- This is the ‘Re-run Scan’ button. If I have continued interacting with the page and maybe caused some new content to show or hide, I will often re-run the scan to ensure I’m seeing the results that match what I’m browsing.
- This is the total number of issues. Think if it like a report card. Ideally, you want ‘0’ issues. In this case, it’s ‘7’.
- Some issues are more severe than others, and axe has classified them into the following buckets: ‘critical’, ‘serious’, ‘moderate’, and ‘minor.’ If you have a large number of issues and wondering where to start, tackle the ‘Critical’ issues first. The number of issues next to each classification is clickable, and doing so will filter which issues get revealed on the right side of the report.
- This is the listing of the issue types. You can expand each of these to reveal where exactly in the page this is occurring, and see tips on how to fix the issue.
- The number on this side shows the number of instances for each issue type. Of the 3 issue types in this screenshot, two of them occur one time on this web page, while one of them (“Links must have discernible text”) was identified 5 times on this page page. Again, this area can be expanded and axe DevTools will try to give you options to identify where this was found, as well as more details around the issue and potential ways to remedy.
The issues found are sometimes about content that is missing, or HTML issues, or even styling issues. After fixing the issues – re-run your scan. Are there zero issues now? Great!
Zero issues means I’m done, right?
axe DevTools is a fantastic tool, but it has its limitations. It scans the DOM tree, but it didn’t try to actually use your site like a human would. Also, it cannot identify things that are more subjective in nature (like if the language used is clear). That said, I find it essential, as it’s a great tool to use regularly for those first-pass issues and low-hanging fruit of things to address.
Bottom line
Fixing issues reported by axe DevTools made me a better front-end developer, as in many cases, the axe DevTools report will check for valid HTML and best practices. I think it could help others, too. It will also helped site’s search engine optimization, as generally things that are good for assistive technologies are also good for automated crawlers. Fixing issues caught by axe DevTools means that you will likely also address issues picked up by other automated scan tools. (And many times that’s enough to avoid drive-by accessibility lawsuits that are just based on blanket scans.)
I’ve made using axe DevTools part of my regular design and development routine.